
GPU utilization can look healthy while an AI deployment wastes most of its capacity. One 2026 optimization report found GPUs utilized at only 5% across tens of thousands of clusters, while AI-driven demand was contributing to projected record U.S. electricity use in 2026 and 2027. That contrast changes the question. Resource utilization isn't about making a dashboard percentage larger. It's about proving that scarce compute, memory, network capacity, and energy are producing useful work, at acceptable latency and cost. (CAST AI's 2026 Kubernetes optimization report)
The problem becomes sharper as an agent fleet grows from a handful of instances to hundreds. Idle containers, oversized memory reservations, serial tool calls, throttled CPUs, and hidden network waits can all coexist with an impressive average CPU graph. This guide treats resource utilization as an operational control problem, not a target to maximize blindly.
Table of Contents
- What Resource Utilization Actually Means for AI Deployments
- The Key Metrics That Reveal True Utilization
- Container Architecture and Resource Efficiency
- Building Dashboards That Show Real Utilization
- Optimization Tactics That Actually Work
- The Visibility Gap That Undermines Optimization
- Real Deployment Scenarios and Lessons Learned
What Resource Utilization Actually Means for AI Deployments
For a traditional web service, CPU and memory often provide a reasonable first approximation of capacity. AI agents behave differently. An agent may spend little CPU while waiting on a model response, consume substantial memory for context and tooling, generate network traffic through several integrations, and create short compute bursts that disappear inside a long averaging window.
That makes high utilization ambiguous. A busy CPU can indicate productive inference preparation, but it can also indicate serialization, garbage collection, compression, or a retry loop. High memory use can reflect useful cache residency, or it can signal a leak that will eventually trigger eviction. A low CPU reading can mean an efficient workload, or it can mean the agent is blocked on network I/O.
The wider resource picture matters beyond software. The UN Global Resources Outlook 2024 reports that annual material extraction rose from about 30 billion tonnes in 1970 to 106.6 billion tonnes in 2024, averaging roughly 2.3% annual growth. The same report records 105.7 billion tonnes of global material consumption in 2019, with 96.2 billion tonnes, or 91%, coming directly from harvesting and extraction. Industrial systems can't treat resources as an abstract pool that expands without consequence.
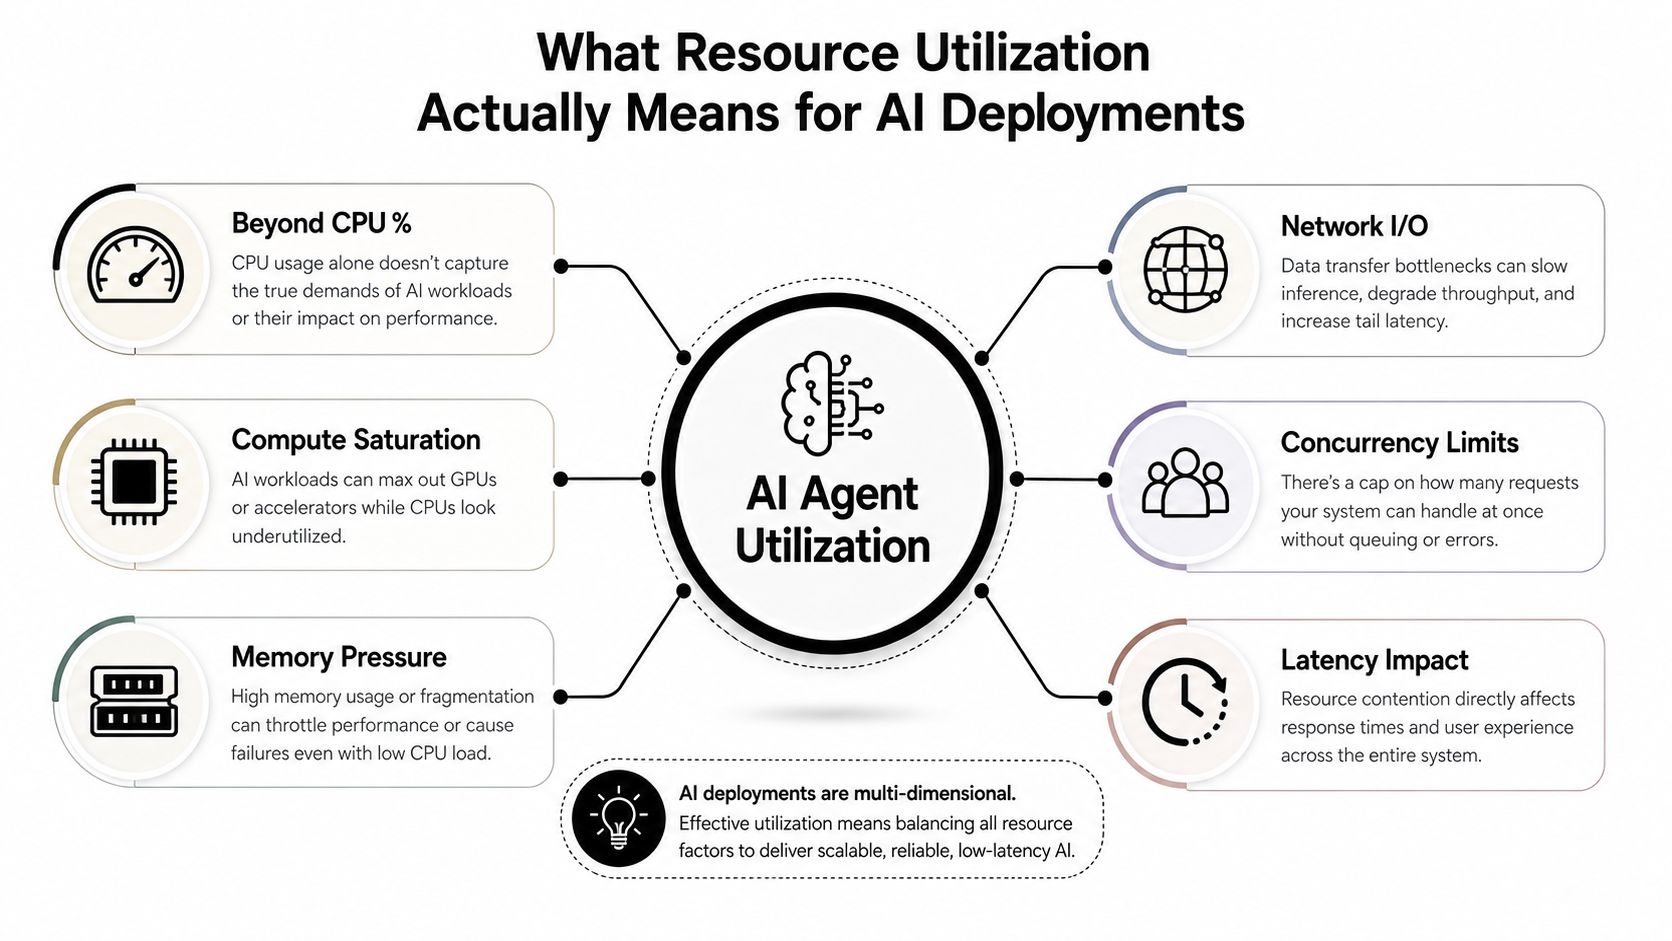
Utilization has several layers
For an AI agent deployment, define utilization across at least four layers:
- Compute work: CPU cycles, GPU activity, throttling, queue time, and burst behavior.
- Memory behavior: Working set, allocation pressure, cache effectiveness, garbage collection, and out-of-memory events.
- Data movement: Network throughput, latency, packet loss, disk reads, writes, and external API wait time.
- Service outcome: Request latency, successful task completion, tool-call success, token throughput, and queue depth.
The last layer prevents a common mistake: rewarding infrastructure activity that doesn't improve user-visible results. A fleet that consumes more CPU but completes no more tasks isn't necessarily better utilized. It may be doing more overhead work.
Practical rule: Treat utilization as useful only when you can connect resource consumption to completed, reliable work.
The Key Metrics That Reveal True Utilization
Start with saturation, not percentage. A CPU graph tells you how much CPU time a process used, but CPU saturation tells you whether runnable work is waiting for that resource. Track run-queue pressure, throttling, load behavior, and latency together. If CPU usage rises while task latency and throttling rise with it, the host is approaching a meaningful limit. If CPU usage rises without service impact, the workload may still have headroom.
GPU telemetry needs the same caution. Record active compute time, memory occupancy, allocation failures, kernel or batch queue behavior, and the relationship between GPU activity and completed inference work. A GPU can be reserved, powered, and visible to a scheduler without doing useful model work.
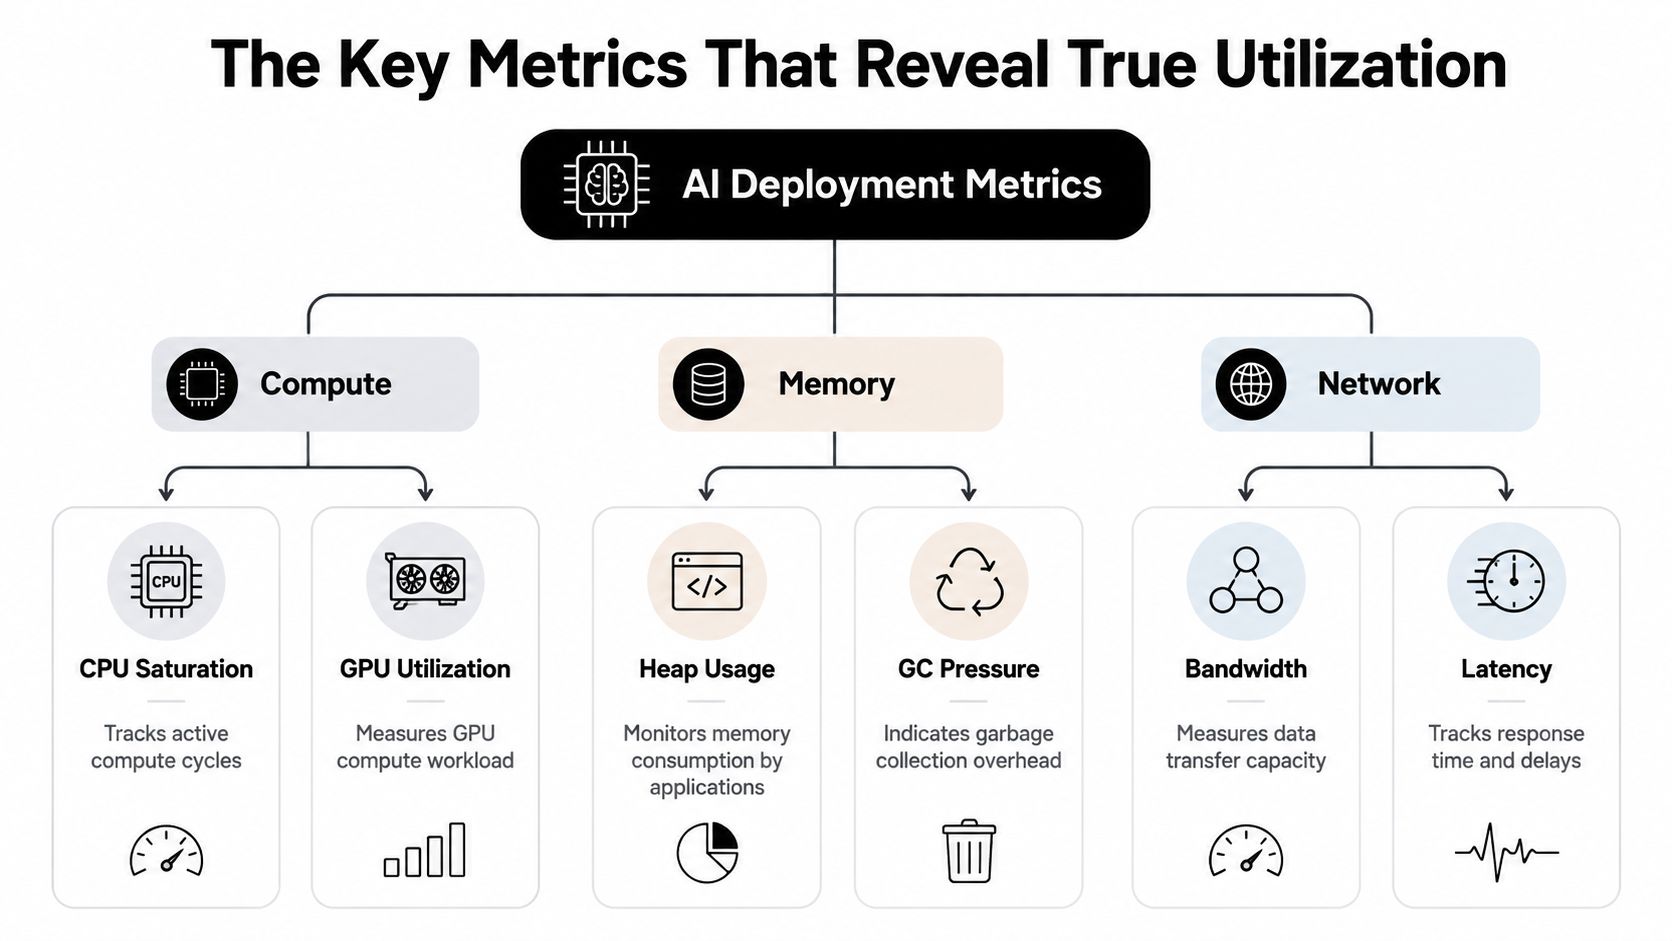
Measure pressure, not just occupancy
Memory requires more than a used-versus-free chart. Watch working-set growth, reclaim activity, garbage-collection pressure, page faults, cache hit behavior, and out-of-memory events. A container with a stable working set may be comfortably sized even when its memory percentage looks high. A container with steadily expanding usage deserves investigation even if its current percentage appears moderate.
Disk and network metrics often expose the bottleneck first. Track read and write latency, queue depth, throughput, retransmissions, packet drops, connection errors, and time spent waiting on external services. An agent that spends most of its lifecycle waiting for a CRM or messaging API isn't a CPU optimization problem.
A container profiling study found that practical monitoring should capture more than 60 Linux metrics across virtual machine, container, and process layers, because CPU, memory, and network I/O affect energy consumption. In one stationary-state example, a container used approximately 0.15 W per hour while reporting about 0.06% CPU and 0.02% memory usage. Those figures come from a measured example, not a universal baseline, but they illustrate why tiny CPU readings don't explain the whole power story. (Container resource profiling study)
Build a metric hierarchy
Use dashboards in layers:
- Outcome layer: Completed tasks, failure rate, latency, queue depth, and tool-call success.
- Service layer: Per-agent CPU, memory, network, disk, token activity, and restart behavior.
- Process layer: Worker attribution, garbage collection, subprocess activity, and blocked operations.
- Host layer: Saturation, power, thermal behavior, and capacity remaining.
This hierarchy lets operators ask the useful question: which resource limits successful work right now?
Container Architecture and Resource Efficiency
For fleets composed of many small, isolated agents, the execution boundary affects density. Containers share the host kernel while separating processes and filesystems. Virtual machines provide a stronger boundary by running separate guest operating systems, but that isolation carries additional overhead.
A comparative study found that running 10 virtual machines required 9.2% more CPU resources and 12.5% more RAM than an equivalent container setup. It also measured 82% higher energy consumption for the virtual-machine configuration than for 10 containers. These results describe the tested environments, not a guarantee for every workload, but the direction is operationally important for multi-instance platforms. (Comparative container and VM study)
| Resource Type | Container Overhead | VM Overhead | Efficiency Gain |
|---|---|---|---|
| CPU | Lower in the comparison | 9.2% higher than containers | More host CPU remains for agent work |
| RAM | Lower in the comparison | 12.5% higher than containers | More memory remains for caches and workers |
| Energy | Lower in the comparison | 82% higher than containers | Lower measured energy overhead |
Choose isolation deliberately
Containers make sense when agents need separate credentials, scoped files, independent restart behavior, and predictable deployment units. They're especially useful when each agent performs a modest amount of work and the host must run many concurrent services. The lighter boundary can reduce idle overhead and improve density.
VMs still have a place. Use them when you need a distinct kernel, stronger tenant separation, incompatible operating-system requirements, or a security boundary that container isolation alone doesn't satisfy. The correct comparison isn't “containers are always better.” It's whether the additional isolation justifies the capacity and operational cost.
Architecture also changes the optimization surface. A large VM can hide several agents inside one opaque resource pool, making attribution difficult. Small containers expose per-instance behavior, but they can create scheduling fragmentation, duplicated sidecars, and more operational objects. Teams evaluating a managed path can review OpenClaw hosting options for isolated AI instances alongside their own container and VM design.
Right-size from observed behavior, then test under realistic concurrency. Don't lower reservations to improve an allocation chart. If memory pressure causes evictions or CPU throttling increases tail latency, the apparent efficiency gain is a regression.
Building Dashboards That Show Real Utilization
A useful dashboard answers three questions quickly: what is slow, what is full, and what work is completing? A wall of gauges doesn't answer any of them. Put service outcomes at the top, resource pressure beneath them, and drill-down views behind each agent, process, and host.
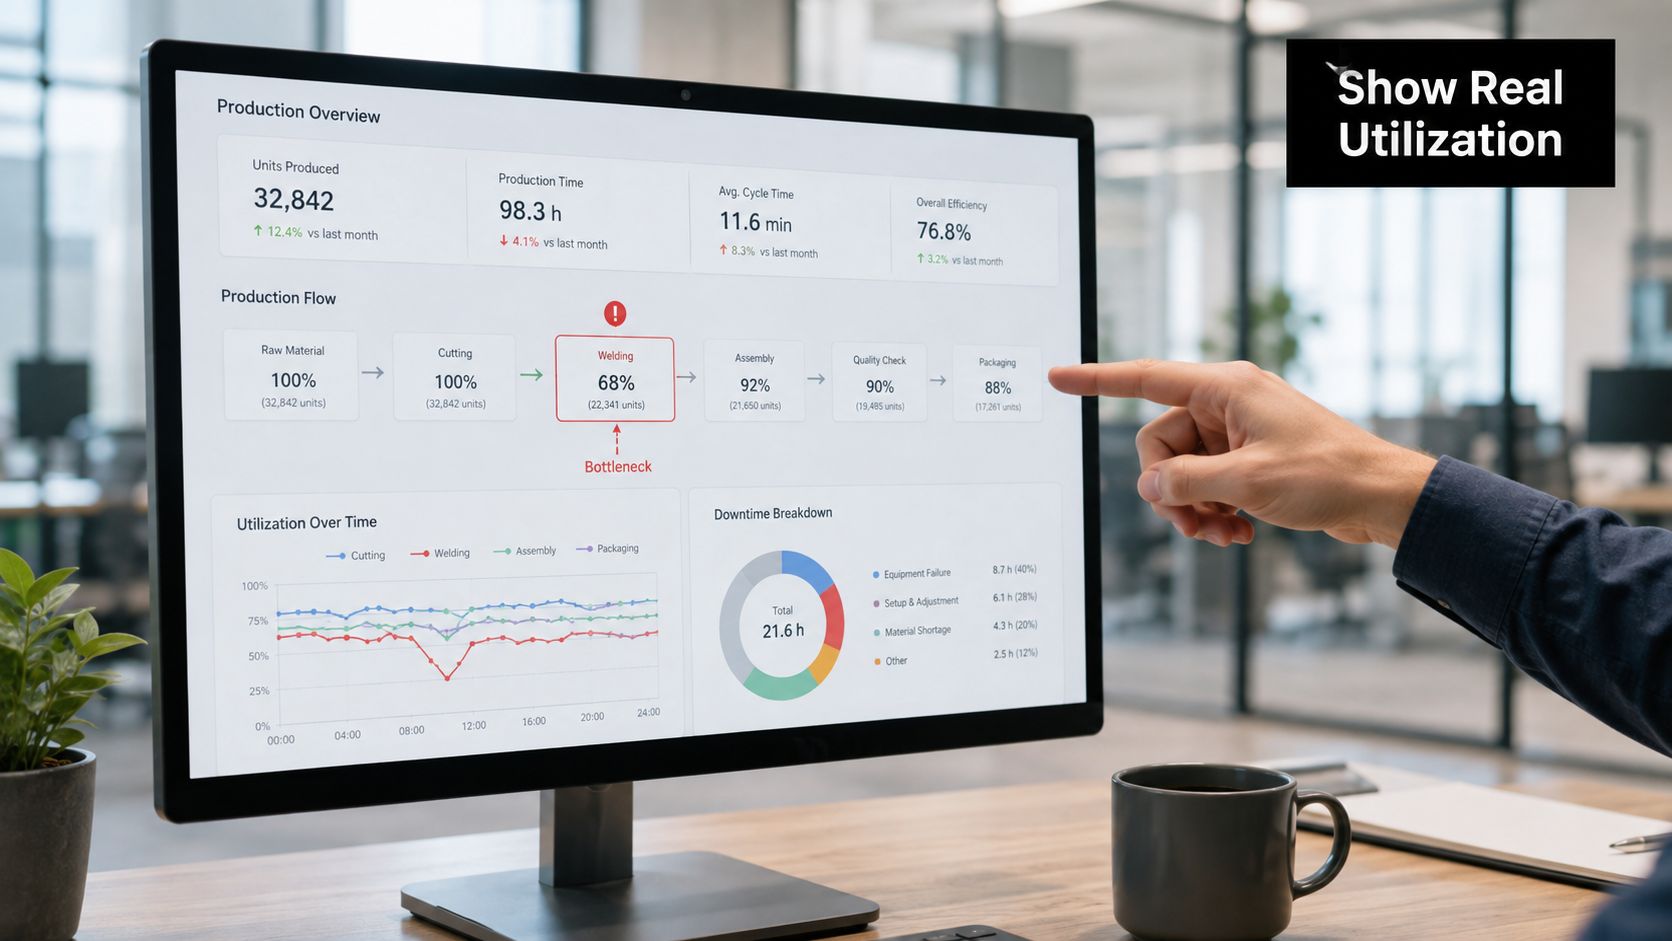
Use views that expose causality
Time-series charts reveal bursts, recurring idle periods, and capacity cliffs. Heatmaps show whether one agent class or tenant consistently runs hot. Scatter plots comparing latency with CPU, memory, or network wait can separate correlation from cause. A table of top consumers is useful during incidents, but it shouldn't become the primary health view.
For every agent, include:
- Demand: Requests, queued tasks, concurrent runs, and scheduled work.
- Outcome: Completion rate, error rate, latency distribution, and retries.
- Compute: CPU and GPU activity, throttling, and saturation.
- Memory: Working set, limits, allocation failures, and restart history.
- I/O: Network wait, external-call latency, disk activity, and connection errors.
- Ownership: Instance, team, client, environment, and cost center.
The ownership fields matter because aggregate utilization can hide a noisy tenant. Tag every workload consistently, then let operators filter by agent, customer, environment, model, and integration. A unified operational view such as Donely integrations can be relevant when teams need to connect agent activity with the systems those agents operate across.
Design alerts around symptoms
Avoid alerting on a single high CPU reading. Alert when sustained pressure combines with a user-facing symptom, such as queue growth, rising latency, failed tasks, or throttling. For memory, pair working-set growth with reclaim activity or restart events. For networking, pair packet loss or connection errors with failed tool calls.
The time window should match the workload. Short windows catch burst-sensitive inference problems. Longer windows expose leaks, recurring schedules, and gradual capacity drift. Review alerts after incidents. A notification that never changes an operator's action is dashboard noise.
Use centralized metrics, logs, traces, and billing records where possible. The operator should be able to move from a slow task to its agent, container, host, integration, and owner without manually joining unrelated systems.
A short visual explanation can help teams align on what each layer measures:
Optimization Tactics That Actually Work
Optimization starts with the bottleneck, not the preferred tool. If agents wait on external APIs, adding CPU won't help. If memory pressure causes restarts, horizontal scaling may multiply instability. If a scarce GPU remains idle because requests arrive irregularly, scheduling and batching deserve attention before purchasing more hardware.
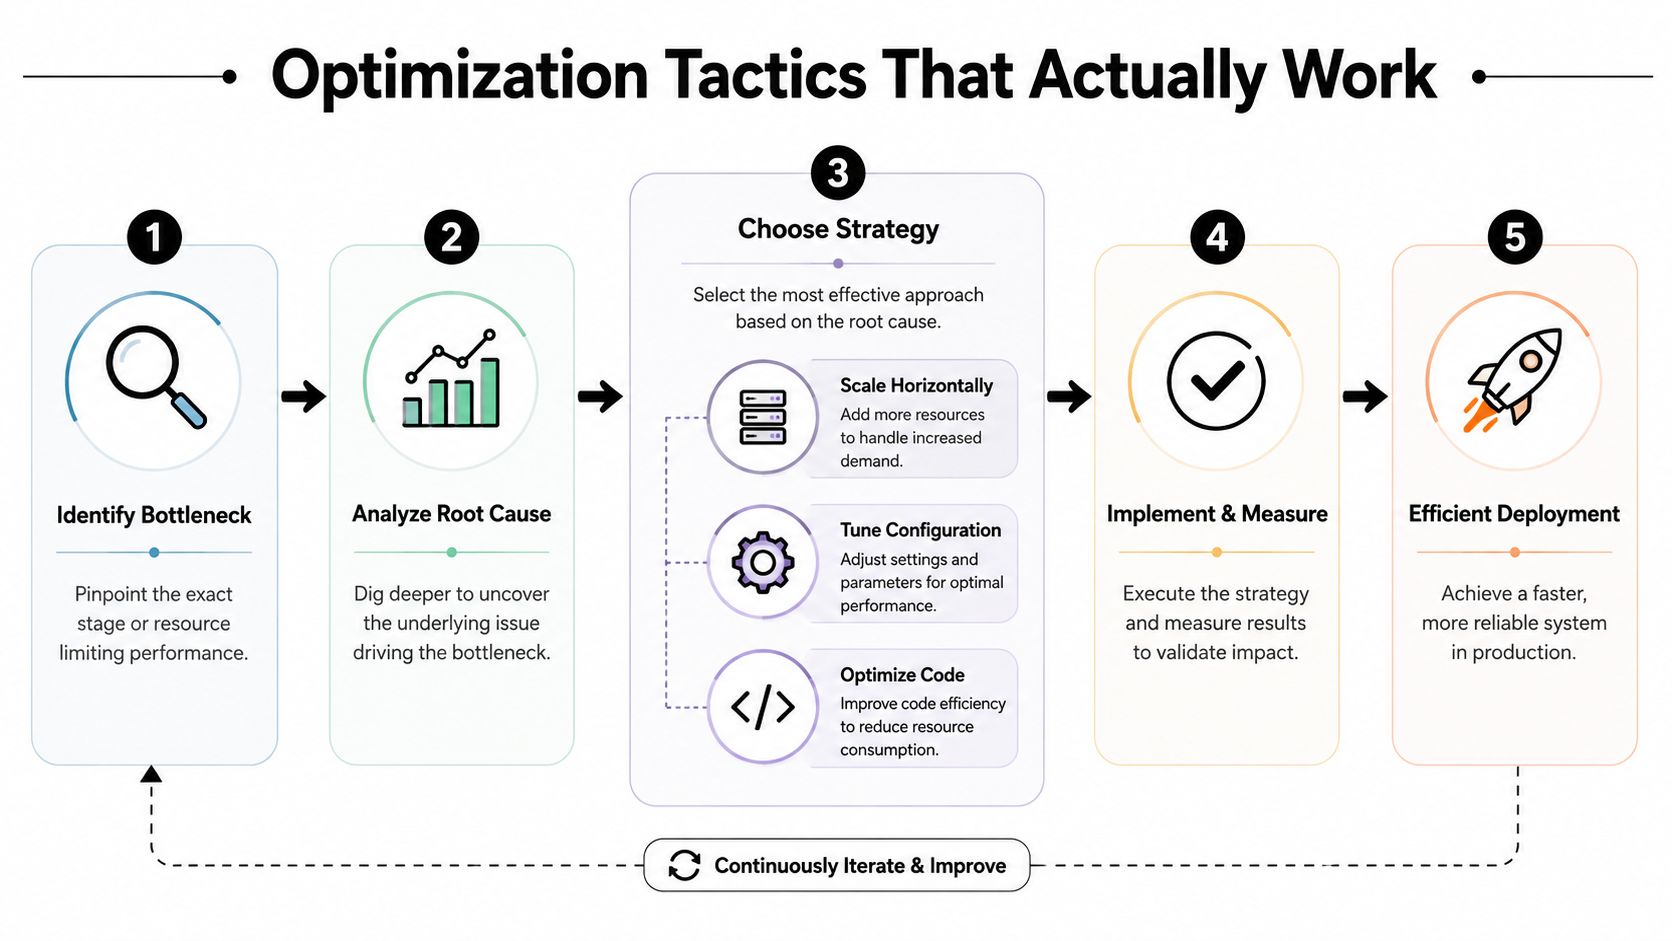
Match the tactic to the failure mode
Scale horizontally when independent agent tasks queue behind a concurrency limit and each replica has a manageable working set. Horizontal scaling improves fault isolation and can absorb uneven demand, but it adds coordination, scheduling, and idle-replica overhead.
Scale vertically when one process needs more memory or compute than a smaller instance can provide. Vertical changes are simpler, but they create larger failure domains and can strand capacity during quiet periods.
Schedule intelligently by separating latency-sensitive work from batch work. Keep interactive agents responsive, then place maintenance, indexing, evaluation, and report generation into available capacity. A scheduler that understands deadlines and priorities is more useful than one that merely fills hosts.
Batch compatible work where latency permits it. Grouping embedding, classification, or document operations can improve accelerator efficiency, but batching increases waiting time and can complicate retries. Measure both throughput and tail latency before keeping the change.
Reduce waste at the source. Cache stable context, avoid repeated tool discovery, cancel abandoned requests, cap retries, and release workers that are waiting on long external calls. Token and compute controls should preserve task quality. Shorter prompts that force repeated clarification aren't an optimization.
Measure the completed outcome, not the resource graph. A lower CPU line is irrelevant if agents finish fewer reliable tasks.
Use a controlled loop:
- Identify the constrained resource.
- Trace the work that consumes it.
- Change one scheduling, configuration, or code behavior.
- Compare latency, completion, failures, and resource pressure.
- Keep the change only if the service outcome improves.
Teams also need a financial view of right-sizing. A practical guide to right-sizing and FinOps for startups can help connect infrastructure decisions with ownership, budgets, and recurring review rather than treating cost as an afterthought.
The best optimization often combines tactics. Schedule background jobs away from interactive peaks, batch only work with compatible latency requirements, then scale replicas based on queue behavior. Don't optimize each layer independently and assume the gains add up. A change that improves GPU occupancy but increases network waits may reduce overall useful utilization.
The Visibility Gap That Undermines Optimization
A utilization number is only as trustworthy as the data behind it. In a 2026 survey, 48% of organizations identified inconsistent or fragmented data as a major obstacle, while 47% cited weak visibility into capacity and demand. Yet average utilization was reported at 72%, a combination that suggests teams can look efficient while lacking the evidence needed to know whether capacity is correctly allocated. (Resource Usage Index 2025 findings)
This is optimization theater. Teams tune averages because averages are easy to present, even when the underlying data joins are incomplete. One dashboard may count allocated resources, another may count observed usage, and a billing system may assign costs using a different owner or time boundary. The resulting percentage looks precise, but it doesn't support a reliable decision.
Establish governance before tuning
Create one utilization definition for each resource and document the measurement boundary. Decide whether the number represents provisioned capacity, observed consumption, active work, or useful completed work. Keep those measures separate. Combining them into one score hides the trade-off you're trying to manage.
Ownership should be explicit:
- Platform owners maintain telemetry quality and resource labels.
- Service owners explain demand, latency, and failure behavior.
- Finance teams reconcile usage with billing and budgets.
- Security teams control who can view or change instance data.
- Leaders set acceptable performance and cost boundaries.
Access control protects the data's meaning as well as its confidentiality. If anyone can change reservations, disable alerts, or move workloads without a record, utilization trends become difficult to interpret. Scoped access and audit history let teams distinguish a real workload change from an undocumented configuration change.
For organizations running many isolated agents, Hermes agent hosting is one option to evaluate when centralized instance management, usage visibility, and access boundaries need to coexist. The operational principle applies regardless of platform: connect resource data, service outcomes, ownership, and billing in the same review cycle.
Real Deployment Scenarios and Lessons Learned
Consider an agency running separate agents for several clients. The aggregate CPU chart looks moderate, but one client experiences delayed CRM updates. Per-instance traces show the agent isn't compute-bound. It waits on a slow integration, retries failed calls, and holds workers open during the wait. The useful fix is bounded retries, asynchronous job handling, and an alert tied to tool-call latency, not a larger host.
A startup moving from personal automation to business workloads faces a different problem. The first deployment often mixes interactive chat, scheduled research, and document processing in the same pool. Quiet periods leave capacity reserved but idle, while scheduled jobs compete with user requests during bursts. Separating workload classes, assigning priorities, and reviewing queue depth gives the team a clearer scaling signal than a single fleet-wide utilization percentage.
An enterprise may have sufficient capacity but poor accountability. Several teams deploy agents under shared credentials, use inconsistent labels, and review infrastructure bills only after the reporting period closes. Governance changes come first: each instance receives an owner, environment, client or department tag, access policy, and review cadence. Only then can the organization identify which workloads deserve right-sizing, consolidation, or a different service level.
The trade-offs don't disappear after tuning. Smaller containers improve isolation and attribution but increase scheduling objects. Aggressive batching can raise throughput while hurting interactive latency. Lower reservations can improve packing until memory pressure produces restarts. Horizontal scaling can reduce queue time while increasing idle capacity during quiet demand.
The reliable pattern is consistent across all three scenarios:
- Find the waiting point: Separate compute saturation from external-service delay.
- Tie usage to outcomes: Track completed tasks, latency, and failures beside infrastructure metrics.
- Assign ownership: Make every workload explainable by a team, client, or cost center.
- Review changes over time: Look for recurring patterns rather than reacting to one peak.
Resource utilization becomes useful when it helps an operator choose the next action. If the number can't tell you whether to reschedule, resize, batch, fix code, or investigate a dependency, it isn't yet the right number.
Donely gives teams a centralized way to host, deploy, and manage multiple isolated AI employee instances, with consolidated status, logs, usage, billing, and access controls. If you're scaling from personal agents to client or business workloads and want less infrastructure overhead, visit Donely to evaluate a managed deployment path.