
An OpenClaw outage usually starts the same way. A bot that handled messages all morning suddenly goes silent, a scheduled workflow finishes without doing anything useful, or the control plane looks healthy while users keep reporting "not responding." In the middle of that, random fixes are tempting. Restart everything. redeploy. edit config by hand. hope.
That approach burns time and often makes the incident harder to read afterward.
OpenClaw troubleshooting works better when you treat it like production incident response. Start with fast checks that eliminate the common failures. Read the logs only after you've narrowed the blast radius. Touch config and networking last, once you know which layer is broken. If you follow that order, you either restore service quickly or collect enough clean evidence to escalate without backtracking.
Table of Contents
- A Practical Playbook for OpenClaw Issues on Donely
- Initial Triage and Quick Fixes
- Interpreting Audit and Container Logs
- Solving Integration and Runtime Failures
- Resolving Access and Network Issues
- Recovery, Rollbacks, and Contacting Support
A Practical Playbook for OpenClaw Issues on Donely
A common failure looks deceptively simple. Someone says the AI employee stopped replying. You open the dashboard, the instance exists, the last deployment looks recent, and there isn't one obvious red banner telling you what broke. At that point, the primary job is deciding whether you're dealing with a gateway problem, a bad token, a broken config reload, a permission boundary, or a deployment path that only fails outside the container.

If you're running OpenClaw on a hosted control plane such as Donely's OpenClaw platform, the same principle applies as it would on a self-managed box. Don't begin with deep debugging. Begin by proving which layer still works. Can the gateway answer? Can the runtime validate config? Can the model authenticate? Can the channel connect? Those answers determine whether this is a five-minute repair or a proper incident.
Practical rule: Every OpenClaw incident should produce a short timeline. What changed, what failed first, what command confirmed it, and what you avoided changing until you had evidence.
This playbook follows the order that holds up under pressure. First response covers service status and automatic repair. Then come logs, where specific signatures usually tell you whether to inspect profiles, permissions, or approval settings. After that, investigate integrations and runtime behavior, then network and access boundaries that only show up in real deployments. If none of that restores service safely, stop digging, roll back, and escalate with clean evidence.
Initial Triage and Quick Fixes
When OpenClaw goes quiet, the first five minutes matter more than the next hour. Most bad incidents get worse because someone changes three things before checking whether the gateway was even reachable.

OpenClaw troubleshooting is concentrated in a small set of repeat problems. Gateway issues account for about 40% of "not responding" cases and authentication failures about 25%, which is why the documented first-response flow starts with openclaw status --all and openclaw doctor because those checks target nearly two-thirds of incidents according to this OpenClaw troubleshooting breakdown.
Start with the commands that answer basic questions
Run these in order:
openclaw status --allopenclaw doctoropenclaw doctor --fixopenclaw logs --followopenclaw config validate
That sequence isn't elegant. It's effective.
openclaw status --all tells you whether the gateway, channels, and supporting services are up from OpenClaw's point of view. You're looking for mismatches, not just outright failure. A service can be "running" while a channel is disconnected, a gateway profile is stale, or a dependency didn't reload after a config change.
openclaw doctor is the fast safety check. The documented workflow notes that the health check evaluates configuration syntax, model authentication, gateway connectivity, and channel status in one pass, and that openclaw doctor --fix is reported to automatically resolve over 80% of common issues in the guidance summarized by Meta Intelligence's troubleshooting writeup.
What healthy and unhealthy output usually tells you
Use the output to classify the problem before you touch anything else.
| Signal from triage | What it usually means | First move |
|---|---|---|
| Gateway unhealthy | OpenClaw isn't serving requests correctly | Re-run status after a controlled restart or reload |
| Auth failure | Token, provider, or model access issue | Verify credentials and model binding before editing other config |
| Config validation error | Bad syntax or unsupported keys | Fix config first, then retry status |
| Channel disconnected | Core runtime may be fine, integration path is broken | Inspect channel-specific logs next |
A few checks outside the CLI also save time:
- Review recent changes: If the outage started right after a config edit, model switch, or deployment, assume that change is involved until proven otherwise.
- Check disk and system headroom: If the host is starved, you can get misleading secondary errors.
- Confirm Node.js compatibility: If a fresh reinstall still fails later, Node.js version is one of the documented next checks, and OpenClaw requires Node.js 22 or above in the guidance cited earlier.
- Pause before editing JSON manually: If validation is already pointing at the issue, random edits often create a second problem.
A fast incident response isn't the one with the most commands. It's the one that answers "which layer failed?" before anyone starts experimenting.
If the doctor pass fixes the issue, verify behavior from the user side immediately. Send a real request through the affected channel. If triage doesn't restore service, move to logs with the symptom already in hand. Don't read logs cold.
Interpreting Audit and Container Logs
Once quick checks fail, logs become the source of truth. The mistake here is opening the full stream and reading everything in order. That's how people waste half an hour on harmless noise while the actual failure was one permission denial twelve lines above the retry loop.

Audit logs and container logs tell different stories. Audit entries answer who did what, which tool profile was active, and whether approval boundaries were crossed. Container logs answer what the runtime tried to start, what failed to initialize, and what kept retrying. If you only read one of those, you'll often misclassify the incident.
Read logs by symptom, not by volume
Start from the observed symptom and work backward.
If the complaint is "agent doesn't reply," first verify the effective tool profile. That symptom-first flow is the documented recommendation in the official troubleshooting guidance, which says to start by verifying profiles and then inspect logs for signatures such as *_PERMISSION_REQUIRED or SYSTEM_RUN_DENIED that indicate approval or allowlist problems in the OpenClaw troubleshooting docs.
From there, filter your reading into three buckets:
- Startup failures: The process never became healthy, or skipped reload after a config write.
- Execution failures: The agent started but a tool call or model invocation failed.
- Policy failures: The agent attempted an action that the environment or allowlist blocked.
A useful operating habit from broader observability practice is to align logs with user-visible behavior and latency spikes instead of reading them as isolated strings. If you want a concise refresher on that mindset, this guide on optimizing web and mobile app performance is worth skimming because the same discipline applies to agent systems: correlate symptoms, traces, and timing before declaring root cause.
Failure signatures that point to the next action
Some log lines are diagnostic shortcuts.
| Log signature | Likely meaning | Next check |
|---|---|---|
NODE_BACKGROUND_UNAVAILABLE |
The node app can only run in foreground mode | Adjust execution expectations or profile choice |
*_PERMISSION_REQUIRED |
Action needs explicit permission | Review approval and access policy |
SYSTEM_RUN_DENIED |
Allowlist or approval gate blocked execution | Inspect run policy and authorized operations |
When browser-state issues are involved, the docs recommend a narrower action than many teams take. Instead of restarting the whole service, stop only the active browser control session with openclaw browser stop --browser-profile <name>, then re-check service state. That preserves the rest of the runtime and avoids introducing unrelated churn.
Log reading rule: The first error after a known-good timestamp matters more than the loudest repeating error.
If config compatibility is the issue, look for stricter backend behavior and toggles that are explicitly called out in the docs, including compat.requiresStringContent, compat.strictMessageKeys, and compat.supportsTools: false. Those aren't generic tuning knobs. They are compatibility levers for backends that reject certain message shapes or tool schemas. When one of those fixes the issue, document why, because otherwise the next engineer may "clean up" the config and bring the incident back.
Solving Integration and Runtime Failures
A healthy OpenClaw core doesn't guarantee a healthy workflow. Plenty of incidents happen when the agent runtime is fine, but the tools around it aren't. Messages stop syncing. CRM writes fail. A channel connects but doesn't deliver the expected action. The fix is to separate agent health from integration health before you decide where to dig.
Separate agent logic from tool failures
Start with a simple test matrix:
| Test | If it passes | If it fails |
|---|---|---|
| Basic chat or command response | Core runtime and model path are probably alive | Stay on core service debugging |
| Read-only integration action | Auth may be valid, permissions may still be limited | Inspect scope and tool mapping |
| Write action to external system | Runtime is healthy and integration likely has correct access | Focus on target API behavior or payload shape |
This matters with systems like Gmail, Slack, Notion, HubSpot, Salesforce, Jira, or Zendesk. A stale token, revoked scope, or changed external permission often looks like "OpenClaw stopped working" to the user. In reality, the agent is functioning and one tool path isn't.
When debugging a third-party connection, verify these in order:
- Credential freshness: Expired or rotated secrets are still the most common silent breakage.
- Permission scope: Read access and write access are often granted separately.
- Target-side policy: The receiving platform may reject operations that were previously allowed.
- Tool binding: The agent may be invoking a profile or integration alias you didn't expect.
If you're managing many connectors, a hosted catalog can reduce the number of places you need to inspect. For example, Donely integrations centralize connection points for a large set of tools, which helps during triage because you can confirm whether the failure is one connector, one instance, or a broader runtime issue.
Runtime checks that prevent false conclusions
Not every failed workflow is an integration problem. Some are capacity or execution-shape problems inside the runtime itself.
Watch for these patterns:
- Burst failures after concurrent tasks: That usually points to resource contention, queueing, or channel saturation rather than bad business logic.
- One workflow fails, others succeed: That often means the issue is tied to a specific tool profile, prompt shape, or payload.
- Everything works in test, nothing works under production traffic: Check limits, worker behavior, and whether your deployment shape matches your assumptions.
A useful analogy comes from frontend engineering. In a React app, the bug isn't always the component that looks broken. Sometimes the underlying issue is rerender pressure, memoization gaps, or state propagation elsewhere. The same kind of disciplined isolation applies here, and this hands-on ReactJS optimization guide is a good reminder to test the execution path, not just the visible symptom.
If one external action fails, don't rewrite the agent. Prove whether the agent failed to decide, failed to call the tool, or succeeded but the target system rejected the action.
One more runtime rule helps in production. If you change both prompt logic and integration credentials at the same time, you lose the ability to attribute cause. Revert one axis, retest, and only then move forward.
Resolving Access and Network Issues
The hardest OpenClaw incidents are the ones that work locally and fail only after deployment. The gateway answers on the host. The service looks healthy from inside the container. Then a remote request times out, a browser profile can't connect, or an external system can't reach the endpoint that looked fine during local testing.
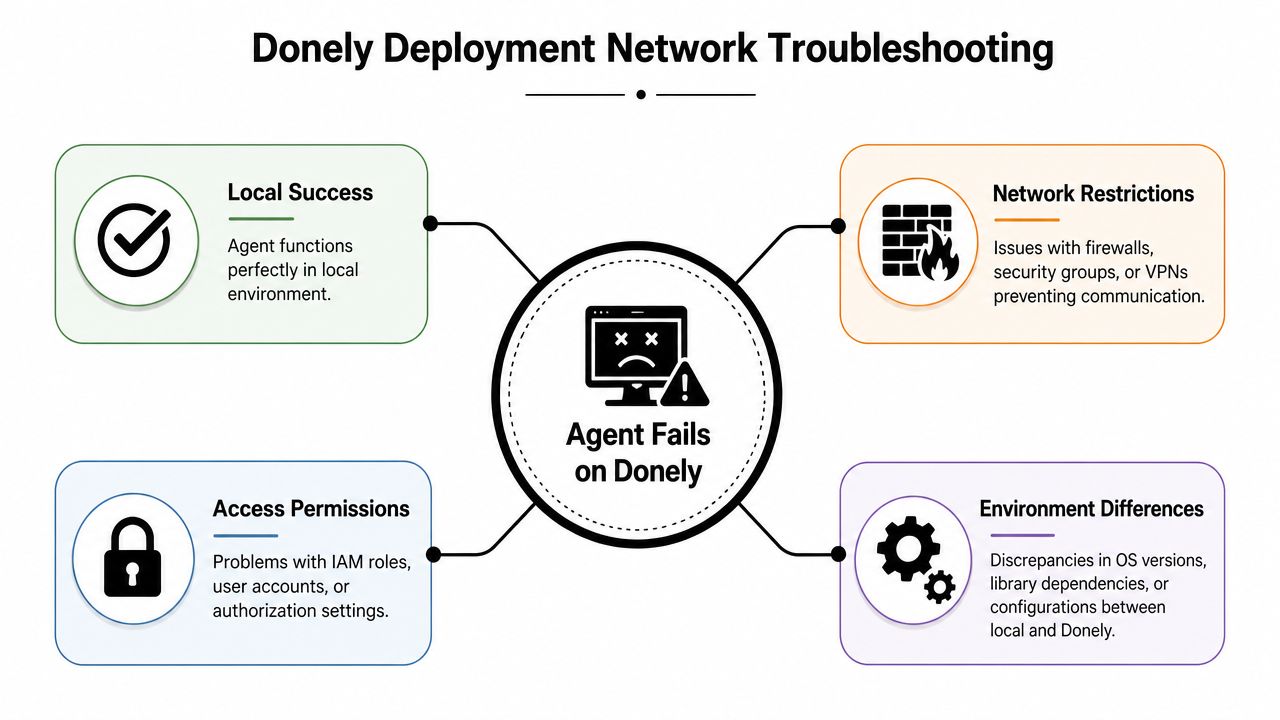
OpenClaw troubleshooting frequently goes astray. Many "not responding" incidents are frequently deployment-topology issues, especially in containers, where bind mode, port exposure, or firewall rules make a locally healthy gateway unreachable externally, as described in the official troubleshooting guide for deployment and networking scenarios.
When localhost works and deployment fails
Treat local success and remote failure as evidence of a boundary issue.
OpenClaw's troubleshooting guidance explicitly points engineers toward bind mode, exposed ports, container health checks, authentication headers, and host-level diagnostics. That's a strong clue that the application may be healthy while the path to it is not. In practice, the break often sits in one of four places:
- The process is bound too narrowly for external access.
- The port is listening but not exposed where you think it is.
- A firewall, proxy, or network policy blocks the path.
- The request arrives without the auth headers or token the gateway expects.
If you're hosting multi-instance deployments, Donely OpenClaw hosting is one example of an environment where those boundaries matter because each instance, container, and access policy can differ even when the applications are configured similarly.
A practical access checklist
Use this checklist when the service works internally but fails from another machine, container, or browser profile.
- Check bind behavior: If the gateway only listens locally, remote callers won't ever reach it.
- Inspect port exposure path: Container port, host mapping, and platform routing all need to line up.
- Test from the failing side: A local curl from inside the container doesn't prove remote reachability.
- Verify auth expectations: Missing or wrong headers can look identical to basic connectivity failure.
- Review browser profile state: Remote browser control can fail because one profile has stale state while the runtime remains healthy.
- Confirm RBAC and approval scope: A reachable service can still deny execution if the caller lacks the right role or run permission.
Production networking failures often present as application bugs because the app is the last thing the user touched.
For webhook-driven workflows, be careful with retries. Repeated failed deliveries can flood logs with symptoms that hide the original rejection. Find the first refusal, not the fiftieth retry. And if the issue only appears in one environment, compare environment variables, approval settings, and network assumptions line by line. "Same config" usually means "same app config," not "same deployment boundary."
Recovery, Rollbacks, and Contacting Support
A rollback is the right call when the clock is running, users are blocked, and the failure started after a known change. Keep digging only if each test is giving you new information. If every action just adds noise to the logs or changes system state, stop and stabilize the service first.
Start by preserving evidence before you touch anything else. Recovery is easier when you can compare the broken state with the last working one.
- Save the current config: Export it or copy the active files before editing.
- Capture command output: Keep the raw results from
openclaw status --all, config validation, and any doctor checks. - Write down the timeline: Record the last known good deployment, the first failed run, and any changes between them.
- Pull a focused log slice: Save the first error and the surrounding lines. Avoid exporting a huge log bundle unless support asks for it.
Then pick the recovery path that changes the fewest things.
| Recovery option | When to use it | Trade-off |
|---|---|---|
| Roll back to last known good config or release | A recent deployment, config edit, or permission change lines up with the failure | Fastest way to restore service, but root cause still needs confirmation |
| Fresh redeploy with preserved settings | The runtime looks corrupted, containers restart unexpectedly, or local state no longer matches config | Clears bad runtime state, but every dependency needs another verification pass |
| Full rebuild after backup | Drift has accumulated across config, runtime, and host layers | Highest effort, but it gives you a clean baseline |
If you have not tried automatic repair yet, run it before opening a ticket:
openclaw doctor --fix
Expected outcome is one of two patterns. Either the tool reports corrected issues and the service returns to normal, or it surfaces a specific failure that points to the next check. Save that output either way. Support can use it, and it also helps you avoid repeating the same dead-end fixes.
What to send in a support ticket
A useful ticket lets another engineer classify the incident in a few minutes instead of starting from zero. Short is fine. Vague is not.
Include these details:
Observed symptom
State what failed from the user's point of view. Example: "Slack commands time out after 30 seconds" is better than "agent broken."Blast radius
Note whether the issue affects one instance, one integration, one workspace, or every environment.Recent change
List the deploy, config edit, model change, secret rotation, network change, or permission update that happened before the failure.Triage output
Attach the results from status checks, doctor output, and validation commands.Relevant logs
Include the first meaningful error and a few lines before and after it.Recovery attempts
Say what you already tried. Restart, token refresh, rollback, redeploy, browser session reset, or host reboot.Environment details
Add versions, deployment target, and whether the failure happens locally, remotely, or only in one environment.
If a reinstall fails in the same way twice, stop repeating it. At that point, the job is deciding whether you are dealing with compatibility, missing system resources, or an external dependency that never recovered. Re-running the same install step rarely changes that diagnosis.
If you're running multiple OpenClaw instances and want fewer moving parts during incidents, Donely gives teams a single place to manage deployments, logs, access boundaries, and instance operations. That does not replace disciplined troubleshooting, but it does make it easier to separate a bad instance from a wider environment problem.